Random Bezier Curves with Bokeh
17 Feb 2015Recently, I have been exploring Bokeh, a Python library for creating beautiful data visualizations in the vein of d3.js. Not only does the library provide a good API for creating anything from histograms to chloropleths, but it also provides support for interactive graphs with real-time data updates, which is especially fascinating for anyone working with streaming data such as stock prices.
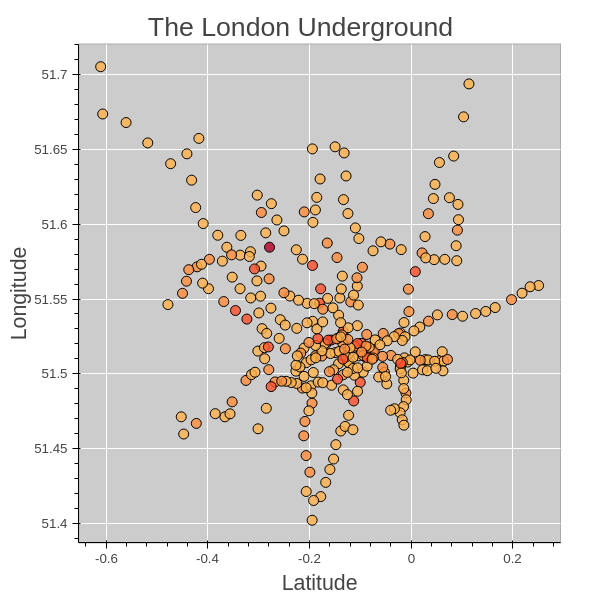
One of my current side-projects involves creating a dynamically updating map of the London Underground and for that I need to create a map-like visualization of the relative positions of the stations. My initial experiments with using only circles to indicate the positions were less than satisfying (see the pseudomap below).
To make the map more realistic, I need to connect the circles together using either lines or curves. Enter Bokeh’s Bezier curve functionality. I am still in the process of figuring out exactly how to create a beautiful tube map using Bezier curves and circles. My primary obstacle lies in understanding the mathematics behind the construction of the Bezier and how this translates to controlling the curvature. For anyone struggling with similar questions, here is a very good introduction to Bezier curves. For now, I have just been experimenting by creating random Bezier curves using Bokeh. Below is an example of Bezier curves with random start and endpoints.
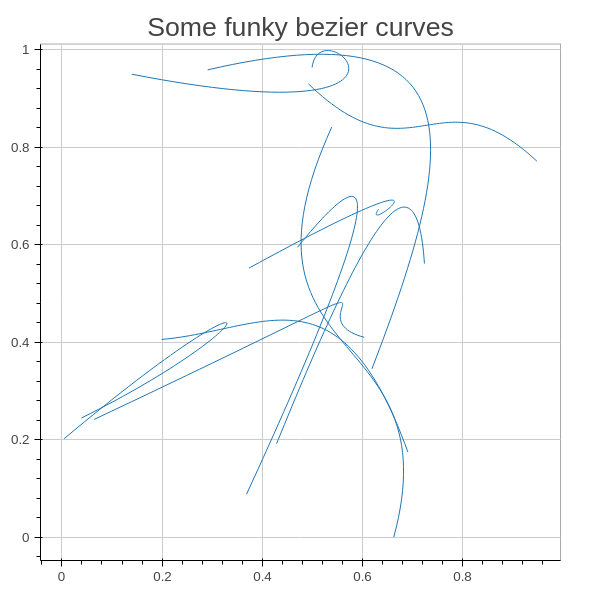
The entire Python snippet used to create the image is given below.
#import the requires libraries
from bokeh.plotting import *
import numpy.random as np

#set the output HTML file, which will contain the graph
output_file('test-tube-map.html')

#generate random start, end and control points
start_point_x=list(np.random_sample(10))
start_point_y=list(np.random_sample(10))
end_point_x=list(np.random_sample(10))
end_point_y=list(np.random_sample(10))

first_control_point_x=[(a+b)/2 for a in start_point_x for b in end_point_x]
first_control_point_y=[(a+b)/2 for a in start_point_y for b in end_point_y]
second_control_point_x=[2*(a+b)/3 for a in start_point_x for b in start_point_x]
second_control_point_y=[2*(a+b)/3 for a in start_point_y for b in end_point_y]

#create the Bokeh plot object
bokeh_plot=figure(title="Some funky Bezier curves")

#add the Bezier curves to the plot object
bokeh_plot.bezier(start_point_x, start_point_y, end_point_x, end_point_y, first_control_point_x, first_control_point_y,
                  second_control_point_x, second_control_point_y)